Player Market Values
Which numbers drive a football player’s market value? We collected the data ourselves and found that the stats explain far less than expected.
The question
Transfer market prices keep climbing, and every season brings new record values. We wanted to know which parts of a player’s performance actually go along with a higher market value, and which do not matter at all.
What we built
A pipeline from the Transfermarkt API into a MySQL database. For every club in the Premier League we fetched the squad, around 600 players, and for each player his market value history and his performance statistics over the years. The data went straight into the database while it was being fetched. From there we prepared one row per player and year, in total about 4,300.
How we analysed it
Exploratory analysis first: distributions, correlations and how market values developed over time. Then two regression models on performance data such as goals, assists, minutes and cards. We also clustered the player-seasons with k-means, and mapped where the players come from.
What came out
11%
of market value explained by performance stats.
3×
Average market value, 2016 to 2019.
Goals and assists go along with higher market values, but only weakly. Cards made no measurable difference.
Together, the performance stats explained about 11 percent of the differences in market value. A random forest, a model that can capture far more complex patterns, did no better. So the problem was not the method but the data. The factors that really set a price were not in our dataset.
A large part of the answer lies outside the player. Between 2016 and 2019, the average market value in our data nearly tripled.
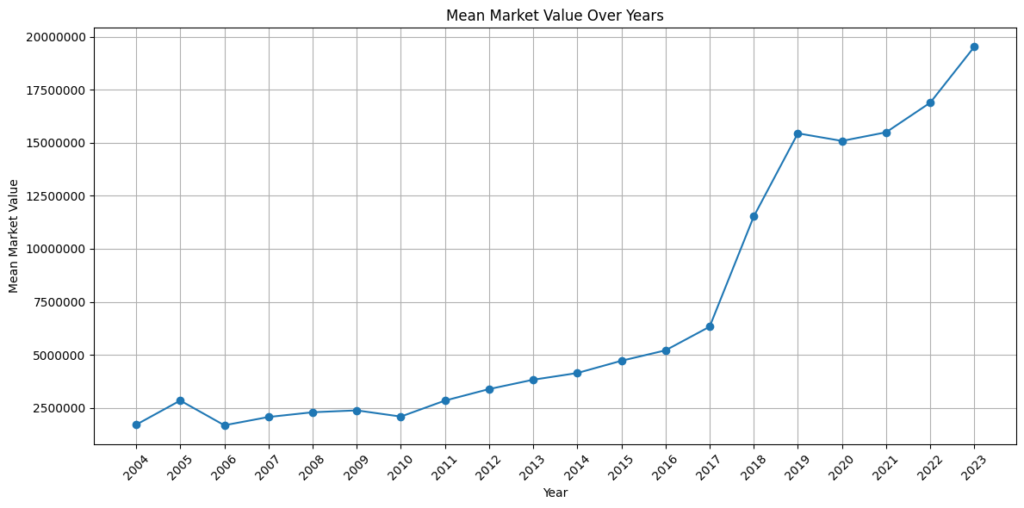
Our conclusion: performance matters, but a market value says as much about the market as about the player.
Decisions
One shared database for the whole team. We configured MySQL for remote access so that all three of us worked on the same data at all times, instead of passing around files that drift apart.
A second model to test the first. When the linear regression explained so little, we added a random forest. Had it scored much better, the linear model would have been the problem. It did not, which pointed to the data instead.
Check the obvious answer. The elbow method suggested four clusters. A silhouette analysis showed that four was actually one of the weaker choices, and we reported that instead of hiding it.