Augmented Analytics
A tool that answers data questions in plain language. I built it, then tested where it holds up and where it does not.
The problem
In many companies the data is there, but analysing it is left to people who write SQL. Everyone else sends a request to IT and waits. Self-service BI tools were meant to fix this, yet they still assume technical skill. My thesis asked what it takes to build a tool that closes this gap, and how good its answers really are.
What I built
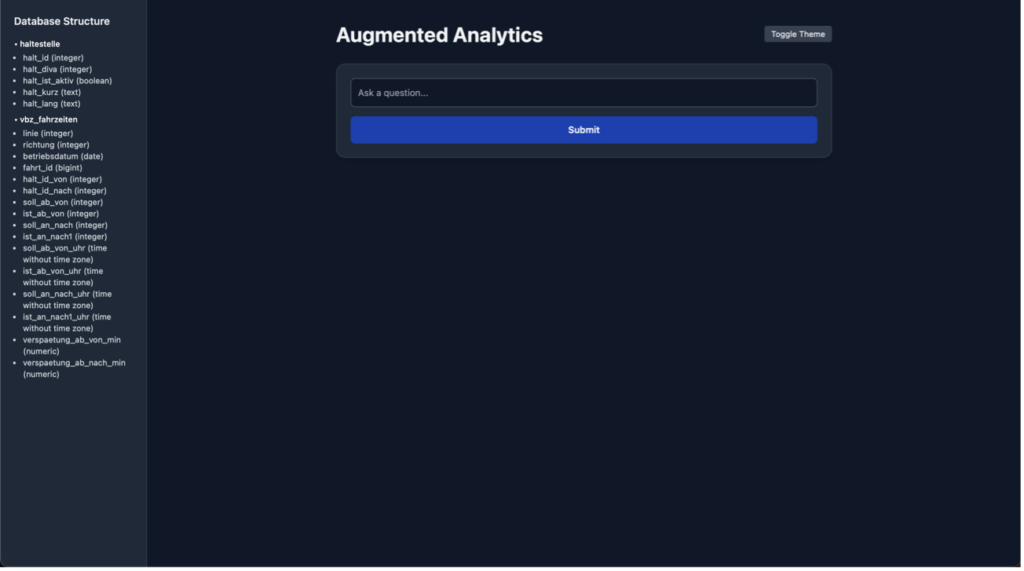
A web app that runs on my own machine. You type a question such as “Which tram line has the highest average delay?” and get back a number, a table or a chart.
The data is real: one week of operating data from Zurich’s public transport operator VBZ, planned against actual times, stored in PostgreSQL. A Flask backend passes the question and the database schema to GPT-4o via API. The model writes SQL and Python, and the app runs that code locally in a restricted environment. After each answer, the tool suggests three follow-up questions.
How I tested it
Thirty questions in three groups of ten: simple figures, charts, and models (regression, classification, clustering). I rated every answer on a five-point scale and logged the response time.
What came out
Figures and charts worked well: seven out of ten answers in each group were good or very good. Models did not: two out of ten. They also took the longest, up to 36 seconds, without getting better for it.
The clearest failure was a clustering request. The tool fixed the number of clusters at three without checking, left out the legend, and plotted trip durations of around minus 80,000 seconds.
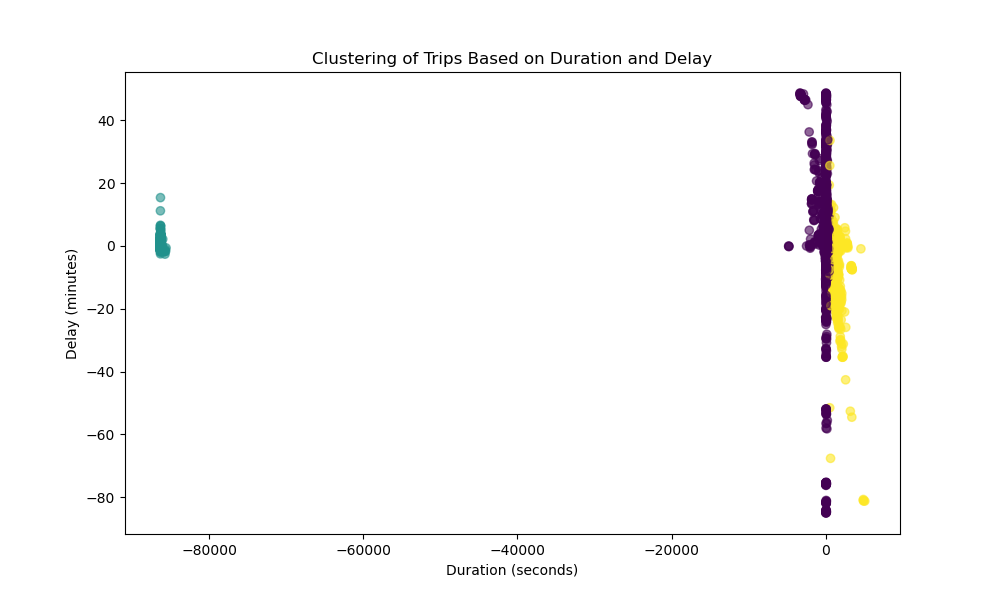
Looking back, these were most likely trips that crossed midnight. The times are stored as seconds after midnight, so a trip from 23:58 to 00:04 comes out at minus one day.
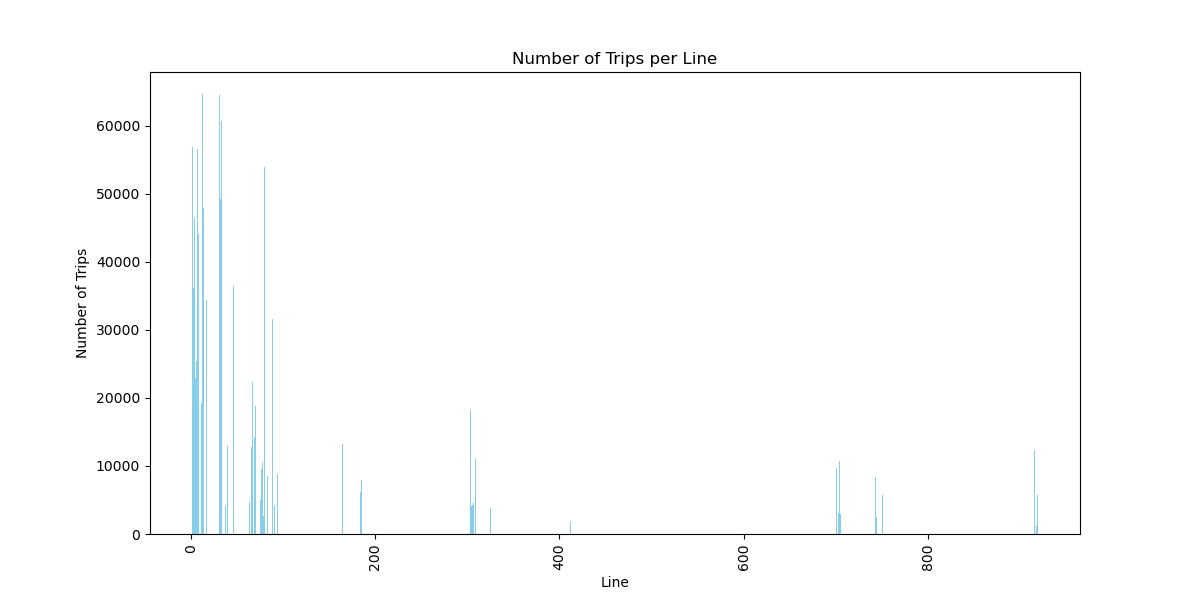
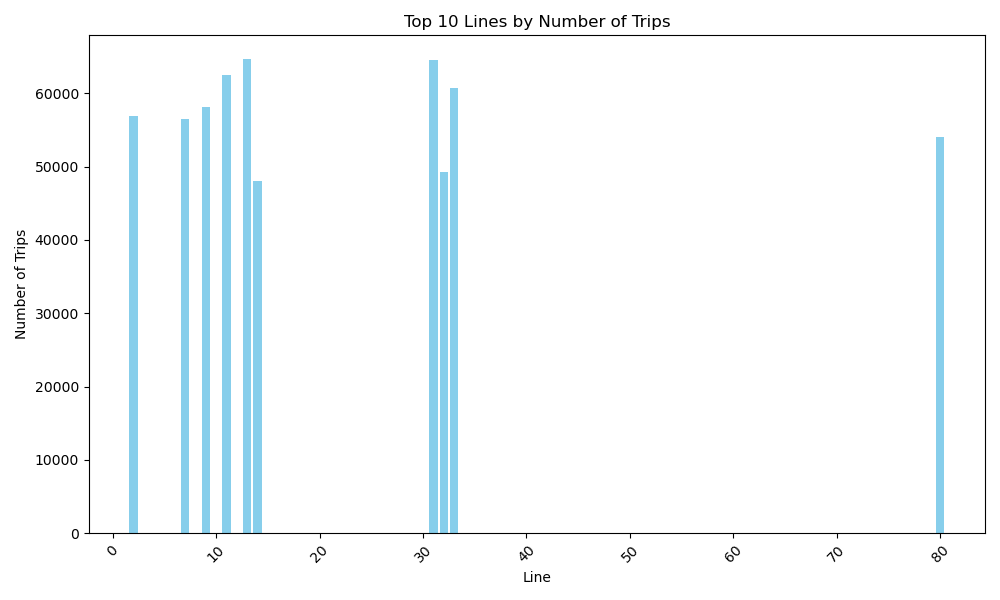
The biggest lever turned out not to be the model but the question. “Plot the number of trips per line” produced an unreadable chart. Adding “top 10 lines” produced a clean one, faster.
My conclusion: a useful way to get first insights without SQL, but not a replacement for an analyst when a question needs several careful steps.
Decisions
Real data instead of a teaching dataset. I chose one week of VBZ operating data because it is realistic, has a clear relational structure and is large enough to test performance. It also meant the tool had to deal with messy values, which is exactly what exposed its limits.
Filter small talk before analysing. Early versions treated every input as a data question, so even “hello” started code generation. I added a first step in which the model decides whether a message is about the data at all.
Force a chart for every model. The model often wrote correct regression or classification code but returned only numbers. One added rule in the prompt, always visualise the result, fixed that. Much of the work lies in precise instructions, not in the model.